(From en.wikipedia.org)
Global warming is the increase in the average measured temperature of the Earth’s near-surface air and oceans since the mid-20th century, and its projected continuation.

The average global air temperature near the Earth’s surface increased 0.74 ± 0.18 °C (1.33 ± 0.32 °F) during the 100 years ending in 2005. The Intergovernmental Panel on Climate Change (IPCC) concludes “most of the observed increase in globally averaged temperatures since the mid-twentieth century is very likely due to the observed increase in anthropogenic (man-made) greenhouse gas concentrations” via an enhanced greenhouse effect. Natural phenomena such as solar variation combined with volcanoes probably had a small warming effect from pre-industrial times to 1950 and a small cooling effect from 1950 onward.
These basic conclusions have been endorsed by at least 30 scientific societies and academies of science, including all of the national academies of science of the major industrialized countries. While individual scientists have voiced disagreement with some findings of the IPCC, the overwhelming majority of scientists working on climate change agree with the IPCC’s main conclusions.
Climate model projections summarized by the IPCC indicate that average global surface temperature will likely rise a further 1.1 to 6.4 °C (2.0 to 11.5 °F) during the twenty-first century. This range of values results from the use of differing scenarios of future greenhouse gas emissions as well as models with differing climate sensitivity. Although most studies focus on the period up to 2100, warming and sea level rise are expected to continue for more than a thousand years even if greenhouse gas levels are stabilized. The delay in reaching equilibrium is a result of the large heat capacity of the oceans.
Increasing global temperature is expected to cause sea levels to rise, an increase in the intensity of extreme weather events, and significant changes to the amount and pattern of precipitation, likely leading to an expanse of tropical areas and increased pace of desertification. Other expected effects of global warming include changes in agricultural yields, modifications of trade routes, glacier retreat, species extinctions and increases in the ranges of disease vectors.
Remaining scientific uncertainties include the amount of warming expected in the future, and how warming and related changes will vary from region to region around the globe. Most national governments have signed and ratified the Kyoto Protocol aimed at reducing greenhouse gas emissions, but there is ongoing political and public debate worldwide regarding what, if any, action should be taken to reduce or reverse future warming or to adapt to its expected consequences.
Terminology
The term “global warming” refers to the warming in recent decades and its projected continuation, and implies a human influence. The United Nations Framework Convention on Climate Change (UNFCCC) uses the term “climate change” for human-caused change, and “climate variability” for other changes.. The term “climate change” recognizes that rising temperatures are not the only effect. The term “anthropogenic global warming” is sometimes used when focusing on human-induced changes.
Causes
The Earth’s climate changes in response to external forcing, including variations in its orbit around the Sun (orbital forcing), changes in solar luminosity, volcanic eruptions, and atmospheric greenhouse gas concentrations. The detailed causes of the recent warming remain an active field of research, but the scientific consensus is that the increase in atmospheric greenhouse gases due to human activity caused most of the warming observed since the start of the industrial era. This attribution is clearest for the most recent 50 years, for which the most detailed data are available. Some other hypotheses departing from the consensus view have been suggested to explain most of the temperature increase. One such hypothesis proposes that warming may be the result of variations in solar activity.
None of the effects of forcing are instantaneous. The thermal inertia of the Earth’s oceans and slow responses of other indirect effects mean that the Earth’s current climate is not in equilibrium with the forcing imposed. Climate commitment studies indicate that even if greenhouse gases were stabilized at 2000 levels, a further warming of about 0.5 °C (0.9 °F) would still occur.
Greenhouse gases in the atmosphere
The greenhouse effect was discovered by Joseph Fourier in 1824 and was first investigated quantitatively by Svante Arrhenius in 1896. It is the process by which absorption and emission of infrared radiation by atmospheric gases warm a planet’s lower atmosphere and surface.

Existence of the greenhouse effect as such is not disputed. Naturally occurring greenhouse gases have a mean warming effect of about 33 °C (59 °F), without which Earth would be uninhabitable. On Earth, the major greenhouse gases are water vapor, which causes about 36–70 percent of the greenhouse effect (not including clouds); carbon dioxide (CO2), which causes 9–26 percent; methane (CH4), which causes 4–9 percent; and ozone, which causes 3–7 percent. The issue is how the strength of the greenhouse effect changes when human activity increases the atmospheric concentrations of some greenhouse gases.
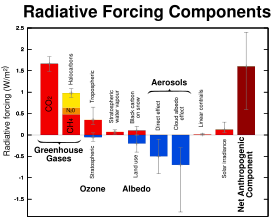
Human activity since the industrial revolution has increased the concentration of various greenhouse gases, leading to increased radiative forcing from CO2, methane, tropospheric ozone, CFCs and nitrous oxide. Molecule for molecule, methane is a more effective greenhouse gas than carbon dioxide, but its concentration is much smaller so that its total radiative forcing is only about a fourth of that from carbon dioxide. Some other naturally occurring gases contribute small fractions of the greenhouse effect; one of these, nitrous oxide (N2O), is increasing in concentration owing to human activity such as agriculture. The atmospheric concentrations of CO2 and CH4 have increased by 31% and 149% respectively since the beginning of the industrial revolution in the mid-1700s. These levels are considerably higher than at any time during the last 650,000 years, the period for which reliable data has been extracted from ice cores. From less direct geological evidence it is believed that CO2 values this high were last attained 20 million years ago. Fossil fuel burning has produced approximately three-quarters of the increase in CO2 from human activity over the past 20 years. Most of the rest is due to land-use change, in particular deforestation.
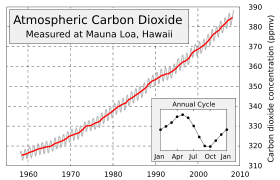
The present atmospheric concentration of CO2 is about 385 parts per million (ppm) by volume. Future CO2 levels are expected to rise due to ongoing burning of fossil fuels and land-use change. The rate of rise will depend on uncertain economic, sociological, technological, and natural developments, but may be ultimately limited by the availability of fossil fuels. The IPCC Special Report on Emissions Scenarios gives a wide range of future CO2 scenarios, ranging from 541 to 970 ppm by the year 2100. Fossil fuel reserves are sufficient to reach this level and continue emissions past 2100, if coal, tar sands or methane clathrates are extensively used.
Feedbacks
The effects of forcing agents on the climate are complicated by various feedback processes.
One of the most pronounced feedback effects relates to the evaporation of water. Warming by the addition of long-lived greenhouse gases such as CO2 will cause more water to evaporate into the atmosphere. Since water vapor itself acts as a greenhouse gas, the atmosphere warms further; this warming causes more water vapor to evaporate (a positive feedback), and so on until other processes stop the feedback loop. The result is a much larger greenhouse effect than that due to CO2 alone. Although this feedback process causes an increase in the absolute moisture content of the air, the relative humidity stays nearly constant or even decreases slightly because the air is warmer. This feedback effect can only be reversed slowly as CO2 has a long average atmospheric lifetime.
Feedback effects due to clouds are an area of ongoing research. Seen from below, clouds emit infrared radiation back to the surface, and so exert a warming effect; seen from above, clouds reflect sunlight and emit infrared radiation to space, and so exert a cooling effect. Whether the net effect is warming or cooling depends on details such as the type and altitude of the cloud. These details are difficult to represent in climate models, in part because clouds are much smaller than the spacing between points on the computational grids of climate models.
A subtler feedback process relates to changes in the lapse rate as the atmosphere warms. The atmosphere’s temperature decreases with height in the troposphere. Since emission of infrared radiation varies with the fourth power of temperature, longwave radiation emitted from the upper atmosphere is less than that emitted from the lower atmosphere. Most of the radiation emitted from the upper atmosphere escapes to space, while most of the radiation emitted from the lower atmosphere is re-absorbed by the surface or the atmosphere. Thus, the strength of the greenhouse effect depends on the atmosphere’s rate of temperature decrease with height: if the rate of temperature decrease is greater the greenhouse effect will be stronger, and if the rate of temperature decrease is smaller then the greenhouse effect will be weaker. Both theory and climate models indicate that warming will reduce the decrease of temperature with height, producing a negative lapse rate feedback that weakens the greenhouse effect. Measurements of the rate of temperature change with height are very sensitive to small errors in observations, making it difficult to establish whether the models agree with observations.
Another important feedback process is ice-albedo feedback. When global temperatures increase, ice near the poles melts at an increasing rate. As the ice melts, land or open water takes its place. Both land and open water are on average less reflective than ice, and thus absorb more solar radiation. This causes more warming, which in turn causes more melting, and this cycle continues.
Positive feedback due to release of CO2 and CH4 from thawing permafrost, such as the frozen peat bogs in Siberia, is an additional mechanism that could contribute to warming. Similarly a massive release of CH4 from methane clathrates in the ocean could cause rapid warming, according to the clathrate gun hypothesis.
The ocean’s ability to sequester carbon is expected to decline as it warms. This is because the resulting low nutrient levels of the mesopelagic zone (about 200 to 1000 m depth) limits the growth of diatoms in favor of smaller phytoplankton that are poorer biological pumps of carbon.
Solar variation
A few papers suggest that the Sun’s contribution may have been underestimated. Two researchers at Duke University, Bruce West and Nicola Scafetta, have estimated that the Sun may have contributed about 45–50 percent of the increase in the average global surface temperature over the period 1900–2000, and about 25–35 percent between 1980 and 2000. A paper by Peter Stott and other researchers suggests that climate models overestimate the relative effect of greenhouse gases compared to solar forcing; they also suggest that the cooling effects of volcanic dust and sulfate aerosols have been underestimated. They nevertheless conclude that even with an enhanced climate sensitivity to solar forcing, most of the warming since the mid-20th century is likely attributable to the increases in greenhouse gases.
A different hypothesis is that variations in solar output, possibly amplified by cloud seeding via galactic cosmic rays, may have contributed to recent warming. It suggests magnetic activity of the sun is a crucial factor which deflects cosmic rays that may influence the generation of cloud condensation nuclei and thereby affect the climate.
One predicted effect of an increase in solar activity would be a warming of most of the stratosphere, whereas greenhouse gas theory predicts cooling there. The observed trend since at least 1960 has been a cooling of the lower stratosphere. Reduction of stratospheric ozone also has a cooling influence, but substantial ozone depletion did not occur until the late 1970s. Solar variation combined with changes in volcanic activity probably did have a warming effect from pre-industrial times to 1950, but a cooling effect since. In 2006, Peter Foukal and other researchers from the United States, Germany, and Switzerland found no net increase of solar brightness over the last 1,000 years. Solar cycles led to a small increase of 0.07 percent in brightness over the last 30 years. This effect is too small to contribute significantly to global warming. One paper by Mike Lockwood and Claus Fröhlich found no relation between global warming and solar radiation since 1985, whether through variations in solar output or variations in cosmic rays. Henrik Svensmark and Eigil Friis-Christensen, the main proponents of cloud seeding by galactic cosmic rays, disputed this criticism of their hypothesis. A 2007 paper found that in the last 20 years there has been no significant link between changes in cosmic rays coming to Earth and cloudiness and temperature.
Temperature changes
Recent
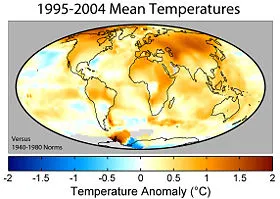
Global temperatures on both land and sea have increased by 0.75 °C (1.35 °F) relative to the period 1860–1900, according to the instrumental temperature record. This measured temperature increase is not significantly affected by the urban heat island effect. Since 1979, land temperatures have increased about twice as fast as ocean temperatures (0.25 °C per decade against 0.13 °C per decade). Temperatures in the lower troposphere have increased between 0.12 and 0.22 °C (0.22 and 0.4 °F) per decade since 1979, according to satellite temperature measurements. Temperature is believed to have been relatively stable over the one or two thousand years before 1850, with possibly regional fluctuations such as the Medieval Warm Period or the Little Ice Age.
Sea temperatures increase more slowly than those on land both because of the larger effective heat capacity of the oceans and because the ocean can lose heat by evaporation more readily than the land. The Northern Hemisphere has more land than the Southern Hemisphere, so it warms faster. The Northern Hemisphere also has extensive areas of seasonal snow and sea-ice cover subject to the ice-albedo feedback. More greenhouse gases are emitted in the Northern than Southern Hemisphere, but this does not contribute to the difference in warming because the major greenhouse gases persist long enough to mix between hemispheres.
Based on estimates by NASA’s Goddard Institute for Space Studies, 2005 was the warmest year since reliable, widespread instrumental measurements became available in the late 1800s, exceeding the previous record set in 1998 by a few hundredths of a degree. Estimates prepared by the World Meteorological Organization and the Climatic Research Unit concluded that 2005 was the second warmest year, behind 1998. Temperatures in 1998 were unusually warm because the strongest El Niño-Southern Oscillation in the past century occurred during that year.
Anthropogenic emissions of other pollutants—notably sulfate aerosols—can exert a cooling effect by increasing the reflection of incoming sunlight. This partially accounts for the cooling seen in the temperature record in the middle of the twentieth century, though the cooling may also be due in part to natural variability. James Hansen and colleagues have proposed that the effects of the products of fossil fuel combustion—CO2 and aerosols—have largely offset one another, so that warming in recent decades has been driven mainly by non-CO2 greenhouse gases.
Paleoclimatologist William Ruddiman has argued that human influence on the global climate began around 8,000 years ago with the start of forest clearing to provide land for agriculture and 5,000 years ago with the start of Asian rice irrigation. Ruddiman’s interpretation of the historical record, with respect to the methane data, has been disputed.
Pre-human climate variations
Earth has experienced warming and cooling many times in the past. The recent Antarctic EPICA ice core spans 800,000 years, including eight glacial cycles timed by orbital variations with interglacial warm periods comparable to present temperatures.
A rapid buildup of greenhouse gases amplified warming in the early Jurassic period (about 180 million years ago), with average temperatures rising by 5 °C (9 °F). Research by the Open University indicates that the warming caused the rate of rock weathering to increase by 400%. As such weathering locks away carbon in calcite and dolomite, CO2 levels dropped back to normal over roughly the next 150,000 years.
Sudden releases of methane from clathrate compounds (the clathrate gun hypothesis) have been hypothesized as both a cause for and an effect of other warming events in the distant past, including the Permian–Triassic extinction event (about 251 million years ago) and the Paleocene–Eocene Thermal Maximum (about 55 million years ago).
Climate models
Scientists have studied global warming with computer models of the climate. These models are based on physical principles of fluid dynamics, radiative transfer, and other processes, with simplifications being necessary because of limitations in computer power and the complexity of the climate system. All modern climate models include an atmospheric model that is coupled to an ocean model and models for ice cover on land and sea. Some models also include treatments of chemical and biological processes. These models predict that the effect of adding greenhouse gases is to produce a warmer climate. However, even when the same assumptions of future greenhouse gas levels are used, there still remains a considerable range of climate sensitivity.

Including uncertainties in future greenhouse gas concentrations and climate modeling, the IPCC anticipates a warming of 1.1 °C to 6.4 °C (2.0 °F to 11.5 °F) by the end of the 21st century, relative to 1980–1999. Models have also been used to help investigate the causes of recent climate change by comparing the observed changes to those that the models project from various natural and human-derived causes.
Current climate models produce a good match to observations of global temperature changes over the last century, but do not simulate all aspects of climate. These models do not unambiguously attribute the warming that occurred from approximately 1910 to 1945 to either natural variation or human effects; however, they suggest that the warming since 1975 is dominated by man-made greenhouse gas emissions.
Global climate model projections of future climate are forced by imposed greenhouse gas emission scenarios, most often from the IPCC Special Report on Emissions Scenarios (SRES). Less commonly, models may also include a simulation of the carbon cycle; this generally shows a positive feedback, though this response is uncertain (under the A2 SRES scenario, responses vary between an extra 20 and 200 ppm of CO2). Some observational studies also show a positive feedback.
In May 2008, it was predicted that “global surface temperature may not increase over the next decade, as natural climate variations in the North Atlantic and tropical Pacific temporarily offset the projected anthropogenic warming”, based on the inclusion of ocean temperature observations.
The representation of clouds is one of the main sources of uncertainty in present-generation models, though progress is being made on this problem.
A recent study by David Douglass, John Christy, Benjamin Pearson and Fred Singer comparing the composite output of 22 leading global climate models with actual climate data finds that the models do not accurately predict observed changes to the temperature profile in the tropical troposphere. The authors note that their conclusions contrast strongly with those of recent publications based on essentially the same data.
Attributed and expected effects
Although it is difficult to connect specific weather events to global warming, an increase in global temperatures may in turn cause broader changes, including glacial retreat, Arctic shrinkage, and worldwide sea level rise. Changes in the amount and pattern of precipitation may result in flooding and drought. There may also be changes in the frequency and intensity of extreme weather events. Other effects may include changes in agricultural yields, addition of new trade routes, reduced summer streamflows, species extinctions, and increases in the range of disease vectors.
Some effects on both the natural environment and human life are, at least in part, already being attributed to global warming. A 2001 report by the IPCC suggests that glacier retreat, ice shelf disruption such as that of the Larsen Ice Shelf, sea level rise, changes in rainfall patterns, and increased intensity and frequency of extreme weather events, are being attributed in part to global warming. While changes are expected for overall patterns, intensity, and frequencies, it is difficult to attribute specific events to global warming. Other expected effects include water scarcity in some regions and increased precipitation in others, changes in mountain snowpack, and adverse health effects from warmer temperatures.
Increasing deaths, displacements, and economic losses projected due to extreme weather attributed to global warming may be exacerbated by growing population densities in affected areas, although temperate regions are projected to experience some benefits, such as fewer deaths due to cold exposure. A summary of probable effects and recent understanding can be found in the report made for the IPCC Third Assessment Report by Working Group II. The newer IPCC Fourth Assessment Report summary reports that there is observational evidence for an increase in intense tropical cyclone activity in the North Atlantic Ocean since about 1970, in correlation with the increase in sea surface temperature (see Atlantic Multidecadal Oscillation), but that the detection of long-term trends is complicated by the quality of records prior to routine satellite observations. The summary also states that there is no clear trend in the annual worldwide number of tropical cyclones.
Additional anticipated effects include sea level rise of 180 to 590 millimeters (0.59 to 1.9 ft) in 2090-2100 relative to 1980-1999, repercussions to agriculture, possible slowing of the thermohaline circulation, reductions in the ozone layer, increased intensity (but less frequent) of hurricanes and extreme weather events, lowering of ocean pH, and the spread of diseases such as malaria and dengue fever. One study predicts 18% to 35% of a sample of 1,103 animal and plant species would be extinct by 2050, based on future climate projections. However, few mechanistic studies have documented extinctions due to recent climate change and one study suggests that projected rates of extinction are uncertain.
Global warming is expected to increase the potential geographic range and virulence of tropical diseases. Climate change could cause a major increase in insect-borne diseases such as malaria throughout Europe, North America and North Asia.
Economic
Some economists have tried to estimate the aggregate net economic costs of damages from climate change across the globe. Such estimates have so far yielded no conclusive findings; in a survey of 100 estimates, the values ran from US$-10 per tonne of carbon (tC) (US$-3 per tonne of carbon dioxide) up to US$350/tC (US$95 per tonne of carbon dioxide), with a mean of US$43 per tonne of carbon (US$12 per tonne of carbon dioxide).
One widely publicized report on potential economic impact is the Stern Review; it suggests that extreme weather might reduce global gross domestic product by up to one percent, and that in a worst-case scenario global per capita consumption could fall 20 percent. The report’s methodology, advocacy and conclusions have been criticized by many economists, primarily around the Review’s assumptions of discounting and its choices of scenarios, while others have supported the general attempt to quantify economic risk, even if not the specific numbers.
Preliminary studies suggest that costs and benefits of mitigating global warming are broadly comparable in magnitude.
According to United Nations Environment Programme (UNEP), economic sectors likely to face difficulties related to climate change include banks, agriculture, transport and others. Developing countries dependent upon agriculture will be particularly harmed by global warming.
Adaptation and mitigation
The broad agreement among climate scientists that global temperatures will continue to increase has led some nations, states, corporations and individuals to implement actions to try to curtail global warming or adjust to it. Many environmental groups encourage individual action against global warming, often by the consumer, but also by community and regional organizations. Others have suggested a quota on worldwide fossil fuel production, citing a direct link between fossil fuel production and CO2 emissions.
There has also been business action on climate change, including efforts at increased energy efficiency and limited moves towards use of alternative fuels. One recently developed concept is that of greenhouse gas emissions trading through which companies, in conjunction with government, agree to cap their emissions or to purchase credits from those below their allowances.
The world’s primary international agreement on combating global warming is the Kyoto Protocol, an amendment to the UNFCCC negotiated in 1997. The Protocol now covers more than 160 countries globally and over 55 percent of global greenhouse gas emissions. Only the United States and Kazakhstan have not ratified the treaty, with the United States historically being the world’s largest emitter of greenhouse gas. This treaty expires in 2012, and international talks began in May 2007 on a future treaty to succeed the current one.
Claiming “serious harm” to the United States economy and the exemption of “80 percent of the world, including major population centers” like China and India from the treaty, U.S. President George W. Bush contends that the Kyoto Protocol is an unfair and ineffective means of addressing global climate change concerns. Bush has promoted improved energy technology as a means to combat climate change, and various state and city governments within the United States have begun their own initiatives to indicate support and compliance with the Kyoto Protocol on a local basis; an example of this being the Regional Greenhouse Gas Initiative. The U.S. Climate Change Science Program is a joint program of over 20 U.S. federal agencies, working together to investigate climate change.
China and India, though exempt from its provisions as developing countries, have ratified the Kyoto Protocol. China may have passed the U.S. in total annual greenhouse gas emissions according to some recent studies. Chinese Premier Wen Jiabao has called on the nation to redouble its efforts to tackle pollution and global warming.
The IPCC’s Working Group III is responsible for crafting reports that deal with the mitigation of global warming and analyzing the costs and benefits of different approaches. In the 2007 IPCC Fourth Assessment Report, they conclude that no one technology or sector can be completely responsible for mitigating future warming. They find there are key practices and technologies in various sectors, such as energy supply, transportation, industry, and agriculture, that should be implemented to reduced global emissions. They estimate that stabilization of carbon dioxide equivalent between 445 and 710 ppm by 2030 will result in between a 0.6 percent increase and three percent decrease in global gross domestic product. According to Working Group III, to limit temperature rise to 2 degrees Celsius, “developed countries as a group would need to reduce their emissions to below 1990 levels in 2020 (on the order of –10 percent to 40 percent below 1990 levels for most of the considered regimes) and to still lower levels by 2050 (40 percent (Sic. 80 percent in Box 13.7, p776) to 95 percent below 1990 levels), even if developing countries make substantial reductions.”
Social and political debate
Increased publicity of the scientific findings surrounding global warming has resulted in political and economic debate. Poor regions, particularly Africa, appear at greatest risk from the projected effects of global warming, while their emissions have been small compared to the developed world. At the same time, developing country exemptions from provisions of the Kyoto Protocol have been criticized by the United States and Australia, and used as part of a rationale for continued non-ratification by the U.S. In the Western world, the idea of human influence on climate has gained wider public acceptance in Europe than in the United States.
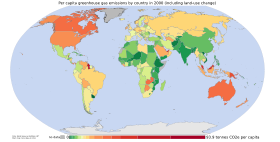
Per capita greenhouse gas emissions in 2000, including land-use change.
The issue of climate change has sparked debate weighing the benefits of limiting industrial emissions of greenhouse gases against the costs that such changes would entail. There has been discussion in several countries about the cost and benefits of adopting alternative energy sources in order to reduce carbon emissions. Organizations and companies such as the Competitive Enterprise Institute and ExxonMobil have emphasized more conservative climate change scenarios while highlighting the potential economic cost of stricter controls. Likewise, various environmental lobbies and a number of public figures have launched campaigns to emphasize the potential risks of climate change and promote the implementation of stricter controls. Some fossil fuel companies have scaled back their efforts in recent years, or called for policies to reduce global warming.

Per country greenhouse gas emissions in 2000, including land-use change.
Another point of contention is the degree to which emerging economies such as India and China should be expected to constrain their emissions. According to recent reports, China’s gross national CO2 emissions may now exceed those of the U.S. China has contended that it has less of an obligation to reduce emissions since its per capita emissions are roughly one-fifth that of the United States. India, also exempt from Kyoto restrictions and another of the biggest sources of industrial emissions, has made similar assertions. However, the U.S. contends that if they must bear the cost of reducing emissions, then China should do the same.
Related climatic issues
A variety of issues are often raised in relation to global warming. One is ocean acidification. Increased atmospheric CO2 increases the amount of CO2 dissolved in the oceans. CO2 dissolved in the ocean reacts with water to form carbonic acid, resulting in acidification. Ocean surface pH is estimated to have decreased from 8.25 near the beginning of the industrial era to 8.14 by 2004, and is projected to decrease by a further 0.14 to 0.5 units by 2100 as the ocean absorbs more CO2. Since organisms and ecosystems are adapted to a narrow range of pH, this raises extinction concerns, directly driven by increased atmospheric CO2, that could disrupt food webs and impact human societies that depend on marine ecosystem services.
Global dimming, the gradual reduction in the amount of global direct irradiance at the Earth’s surface, may have partially mitigated global warming in the late 20th century. From 1960 to 1990 human-caused aerosols likely precipitated this effect. Scientists have stated with 66–90% confidence that the effects of human-caused aerosols, along with volcanic activity, have offset some of the global warming, and that greenhouse gases would have resulted in more warming than observed if not for these dimming agents.
Ozone depletion, the steady decline in the total amount of ozone in Earth’s stratosphere, is frequently cited in relation to global warming. Although there are areas of linkage, the relationship between the two is not strong.


